
Paramount GPU Guide
Why do high-end GPUs cost so much?
More processing power. More memory. Bigger demands.
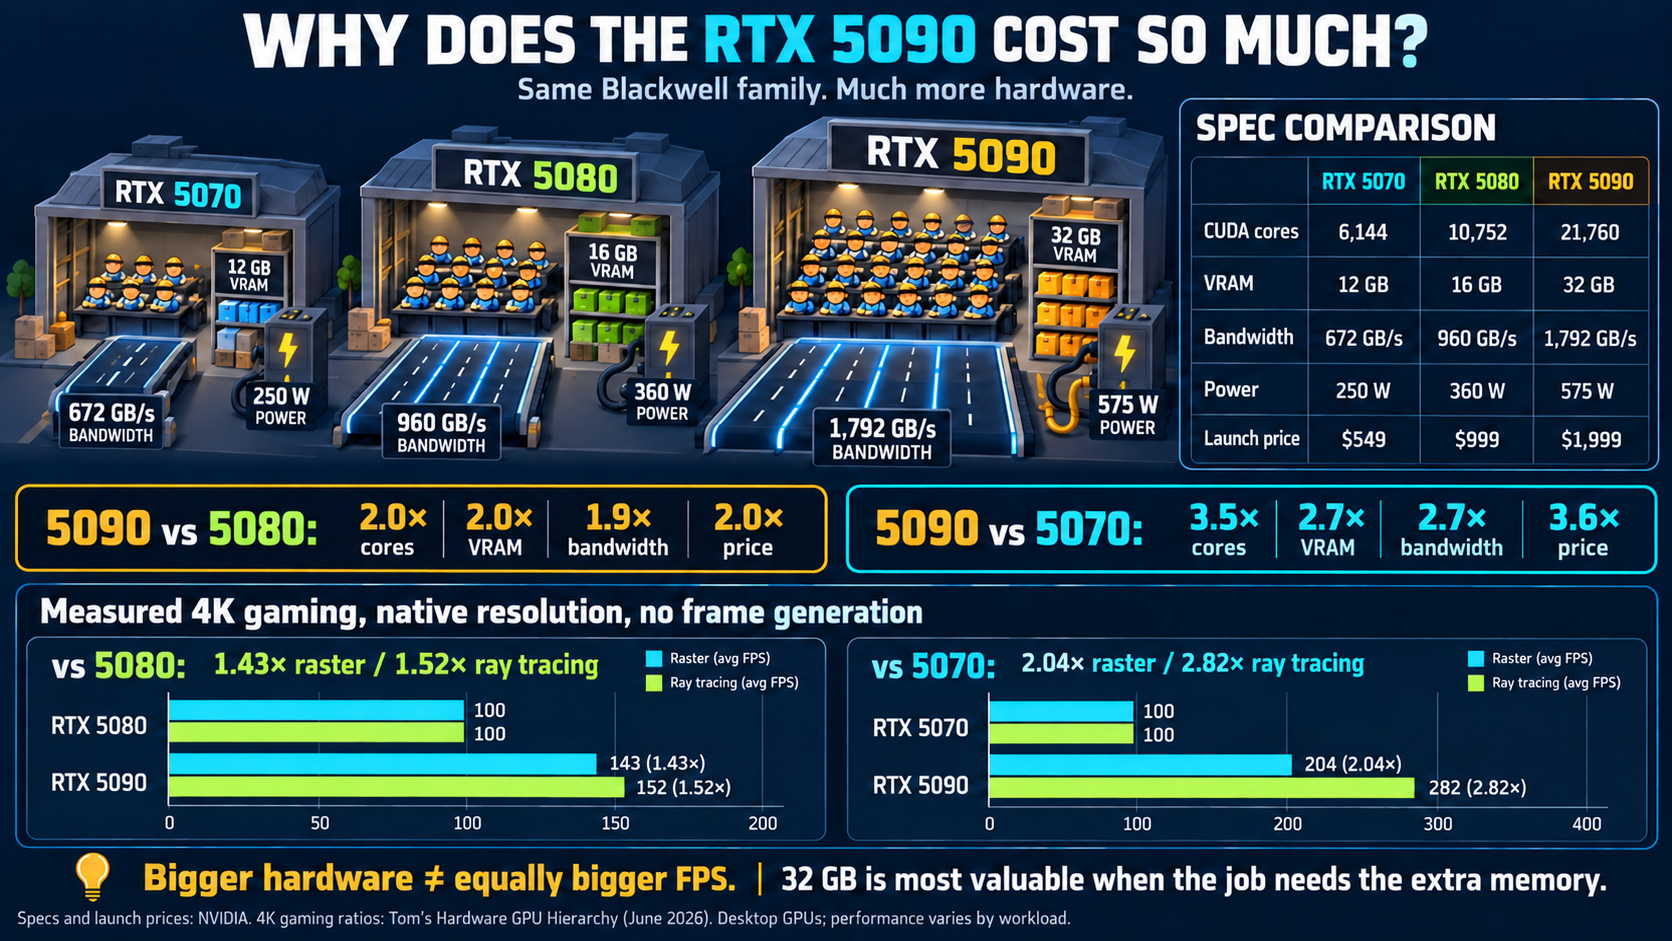
| Specification | RTX 5070 | RTX 5080 | RTX 5090 |
|---|---|---|---|
| CUDA cores | 6,144 | 10,752 | 21,760 |
| VRAM | 12 GB | 16 GB | 32 GB |
| Memory bandwidth | 672 GB/s | 960 GB/s | 1,792 GB/s |
| Graphics power | 250 W | 360 W | 575 W |
| Launch MSRP | $549 | $999 | $1,999 |
Original US launch prices shown; current retail prices vary. Power figures are reference total graphics power, not constant consumption.
What do you actually get?
More workers
More cores handle calculations. The 5090 has about twice as many as the 5080, though game speed does not increase in direct proportion.
A bigger workbench
32 GB makes room for larger projects. Extra memory helps when a game, render or local AI model needs more space.
Faster deliveries
More bandwidth moves data faster. A wider memory connection helps feed all those processing cores.
5090 vs 5080: about 2× the cores and memory, but about 1.4–1.5× the measured 4K gaming performance.
In Tom’s Hardware’s June 2026 test suite, the 5090 averaged 1.43× the 5080’s frame rate in traditional rendering and 1.52× with ray tracing. Compared with the 5070, the ratios were 2.04× and 2.82×. Infographic bars use an index of 100 for each comparison card; they are not absolute FPS. Tests used native 4K resolution without upscaling or frame generation; results vary by game and system.
Sources: NVIDIA specifications · NVIDIA launch prices · Tom’s Hardware GPU Hierarchy. Guide dated September 26, 2026.